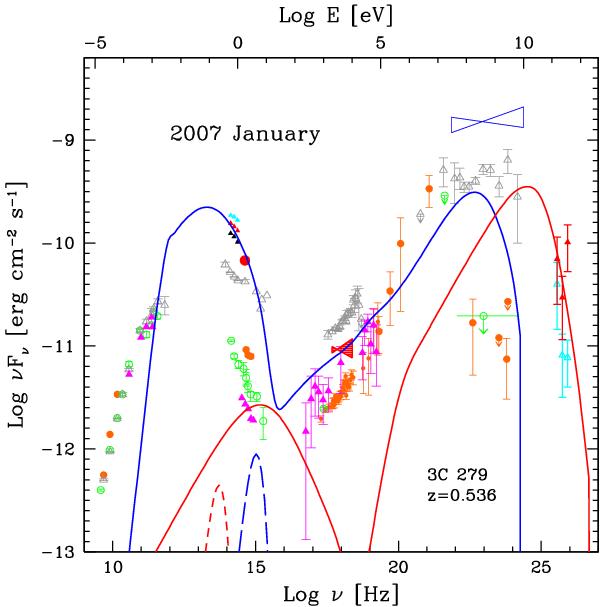
Fig. 9

The spectral energy distribution of 3C 279 on January 2007 16th (MJD 54 116). The red symbols show the REM (MJD 54 114.4, triangles), KVA (filled circle), RXTE (bow-tie) and MAGIC (deabsorbed, triangles) data used to fit the two-zone model (see text). Blue line shows the emission from the zone inside BLR and red line the emission from outside the BLR. Additionally REM data from MJD 54 113.3 (Maximum of the REM lightcurve) cyan and MJD 54 117.3 (black) are shown. The dashed lines correspond to blackbody radiation from the IR torus (red) and BLR (blue). The historical data as in Fig. 8.
Current usage metrics show cumulative count of Article Views (full-text article views including HTML views, PDF and ePub downloads, according to the available data) and Abstracts Views on Vision4Press platform.
Data correspond to usage on the plateform after 2015. The current usage metrics is available 48-96 hours after online publication and is updated daily on week days.
Initial download of the metrics may take a while.


