Fig. 8

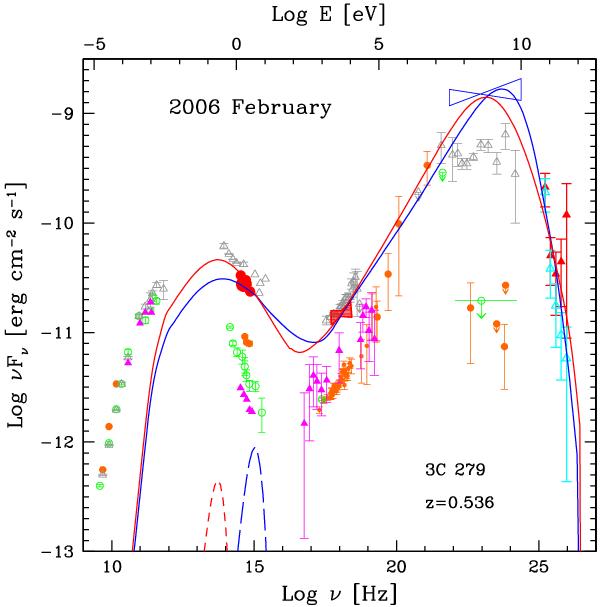
The spectral energy distribution of 3C 279 on February 23, 2006. The red symbols show the optical (filled circles), RXTE (bow-tie) Böttcher (2009) and MAGIC deabsorbed data (triangles) used to fit the two model curves: blue line assuming EC inside the BLR and red line EC outside the BLR. Also MAGIC observed data is shown (cyan). For comparison also historical data are shown: 1991 high state (gray: Hartman et al. 1996), 1993 low state (green: Maraschi et al. 1993) 1996 high state (orange, blue bow-tie: Ballo et al. 2002; Wehrle et al. 1998) and 2003 low state (magenta: Collmar et al. 2004). The dashed lines correspond to blackbody radiation from the IR torus (red) and BLR (blue).
Current usage metrics show cumulative count of Article Views (full-text article views including HTML views, PDF and ePub downloads, according to the available data) and Abstracts Views on Vision4Press platform.
Data correspond to usage on the plateform after 2015. The current usage metrics is available 48-96 hours after online publication and is updated daily on week days.
Initial download of the metrics may take a while.


