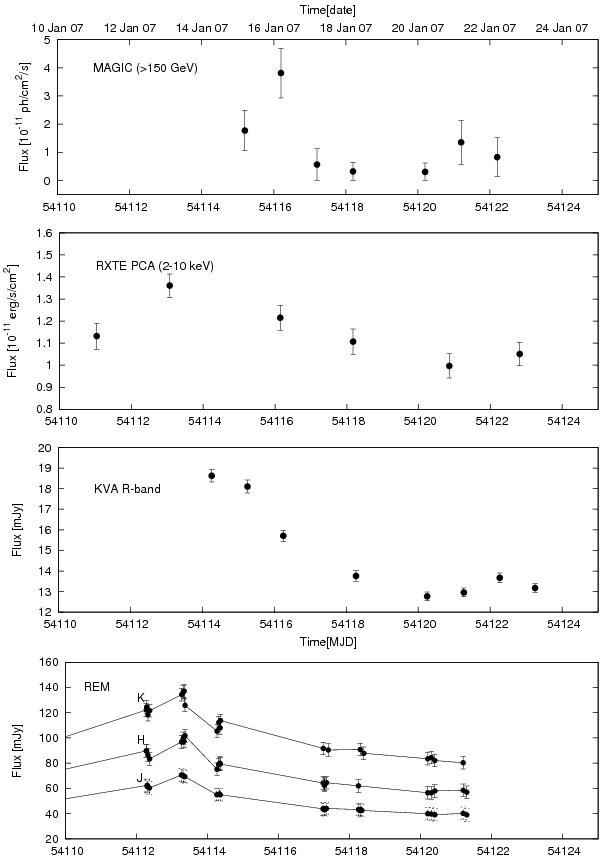
Fig. 5

Light curve in different energy bands during the 2007 observation campaign. From top to bottom: VHE γ-ray flux above 150 GeV as measured by MAGIC, RXTE PCA flux in the 2–10 keV range (Chatterjee et al. 2008), KVA R-band observations and REM infrared observations. For the MAGIC light curve the night by night flux is calculated assuming that 3C 279 always emits γ-rays above 150 GeV.
Current usage metrics show cumulative count of Article Views (full-text article views including HTML views, PDF and ePub downloads, according to the available data) and Abstracts Views on Vision4Press platform.
Data correspond to usage on the plateform after 2015. The current usage metrics is available 48-96 hours after online publication and is updated daily on week days.
Initial download of the metrics may take a while.


