Free Access
Fig. 22
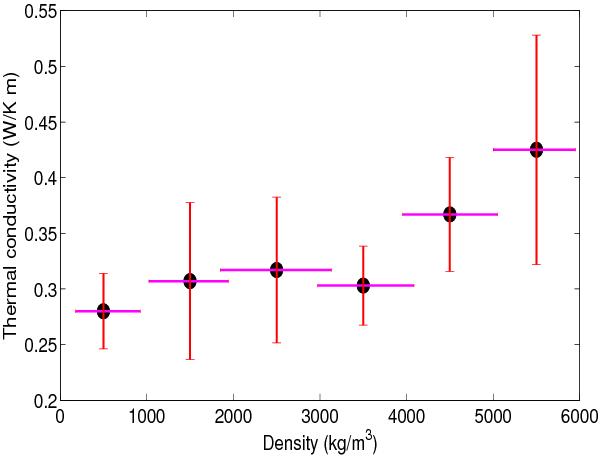
Plot of Thermal conductivity versus bulk density of our sample. The data are binned in approximately 1000 kg m-3 steps (indicated by the extent of the horizontal errors bar and the vertical error bars are the standard error of the mean in that bin).
Current usage metrics show cumulative count of Article Views (full-text article views including HTML views, PDF and ePub downloads, according to the available data) and Abstracts Views on Vision4Press platform.
Data correspond to usage on the plateform after 2015. The current usage metrics is available 48-96 hours after online publication and is updated daily on week days.
Initial download of the metrics may take a while.