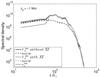
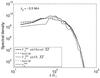
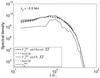
Fig. 7
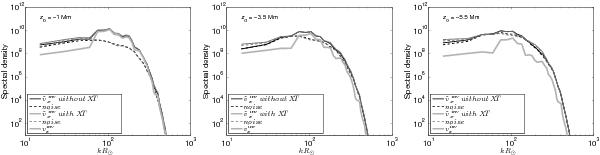
The azimuthally-averaged power spectra of various components of the vx inversions using travel times averaged over 4 days. For reference, we plot the power spectrum of  (thick grey solid line). We plot also the power spectrum of
  (solid line) and the power spectrum of the noise (i.e., the power spectrum of
  ; dashed line) for the inversion where the cross-talk is minimised (black) and ignored (grey).
Current usage metrics show cumulative count of Article Views (full-text article views including HTML views, PDF and ePub downloads, according to the available data) and Abstracts Views on Vision4Press platform.
Data correspond to usage on the plateform after 2015. The current usage metrics is available 48-96 hours after online publication and is updated daily on week days.
Initial download of the metrics may take a while.