Fig. 3
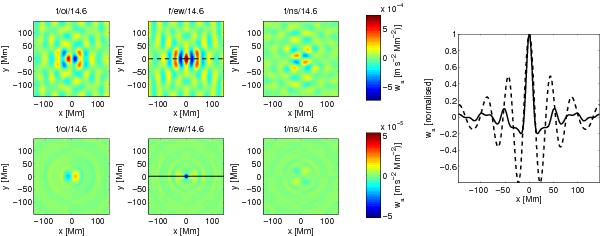
Example inversion weights  for 1 Mm depth and effect of the minimisation of the spread S. A strong regularisation ϵ confines the inversion weights in the spatial domain (bottom row, ϵ = 100.5) compared to the case ϵ = 0 (top row). The cut at y = 0 (horizontal black line) is displayed on the right-hand-side panel, where the values of
  were scaled by
  .
.
Current usage metrics show cumulative count of Article Views (full-text article views including HTML views, PDF and ePub downloads, according to the available data) and Abstracts Views on Vision4Press platform.
Data correspond to usage on the plateform after 2015. The current usage metrics is available 48-96 hours after online publication and is updated daily on week days.
Initial download of the metrics may take a while.