Fig. 20
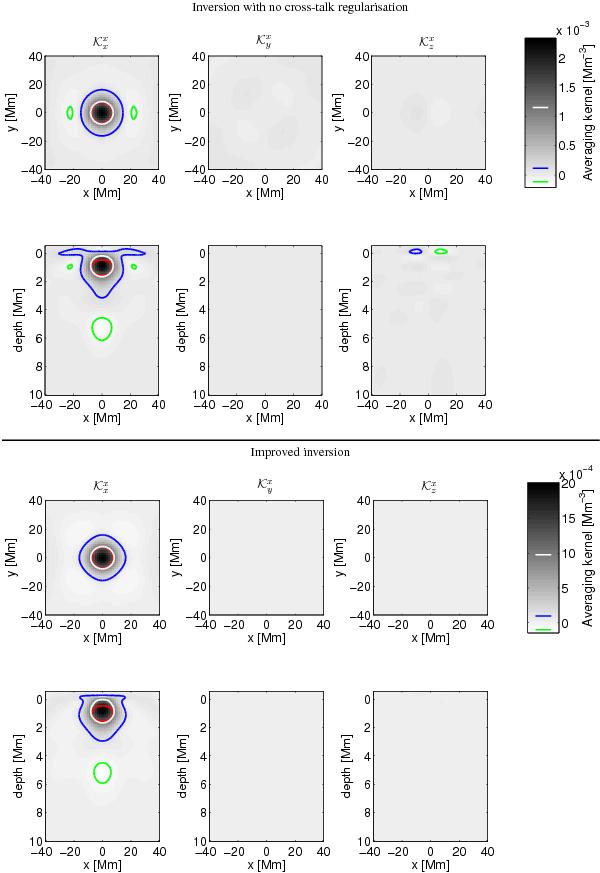
All components of the averaging kernel for vx inversion at 1 Mm depth with a FWHM of sz = 1.1 Mm and sh = 15 Mm. Bottom row: with cross-talk minimised, top row: cross-talk is ignored. Random error of the results is 14 m s-1 when assuming data averaged over 4 days. Over-plotted contours, which are also marked on the colour bar for reference, denote the following: half-maximum of the kernel (white), half-maximum of the target function (red), and ± 5% of the maximum value of the kernel (blue and green, respectively).
Current usage metrics show cumulative count of Article Views (full-text article views including HTML views, PDF and ePub downloads, according to the available data) and Abstracts Views on Vision4Press platform.
Data correspond to usage on the plateform after 2015. The current usage metrics is available 48-96 hours after online publication and is updated daily on week days.
Initial download of the metrics may take a while.