Fig. 5
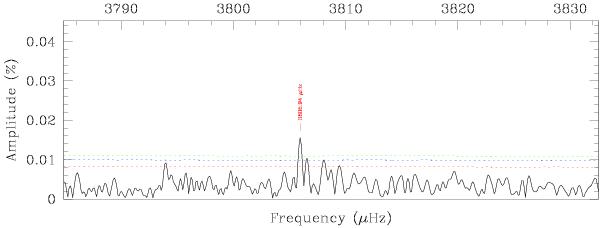
Lomb-Scargle periodogram (LSP) in the 3785–3830 μHz frequency range where a weak signal is also suspected. The green (blue, red) dotted curves refer to a value equal to 4.0 (3.6, 3.0) times the local mean noise level. The indicated peak at 3805.94 μHz (f38 in Table 1) clearly emerges at 5.7 times the average noise.
Current usage metrics show cumulative count of Article Views (full-text article views including HTML views, PDF and ePub downloads, according to the available data) and Abstracts Views on Vision4Press platform.
Data correspond to usage on the plateform after 2015. The current usage metrics is available 48-96 hours after online publication and is updated daily on week days.
Initial download of the metrics may take a while.