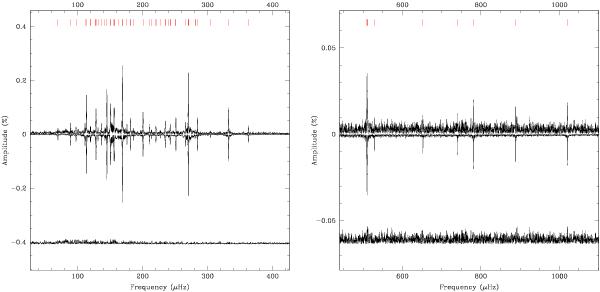
Fig. 4

Lomb-Scargle periodogram (LSP) in the 50–450 μHz frequency range (left panel) and the 450–1100 μHz frequency range (right panel), where signal is found. The reconstructed LSP based on the extracted harmonic oscillations given in Table 1 (indicated by red vertical segments) is shown upside down. The curve shifted downward is the LSP of the residual (i.e., noise) after subtracting all the frequencies of Table 1 from the observed light curve.
Current usage metrics show cumulative count of Article Views (full-text article views including HTML views, PDF and ePub downloads, according to the available data) and Abstracts Views on Vision4Press platform.
Data correspond to usage on the plateform after 2015. The current usage metrics is available 48-96 hours after online publication and is updated daily on week days.
Initial download of the metrics may take a while.


