Free Access
Fig. 9
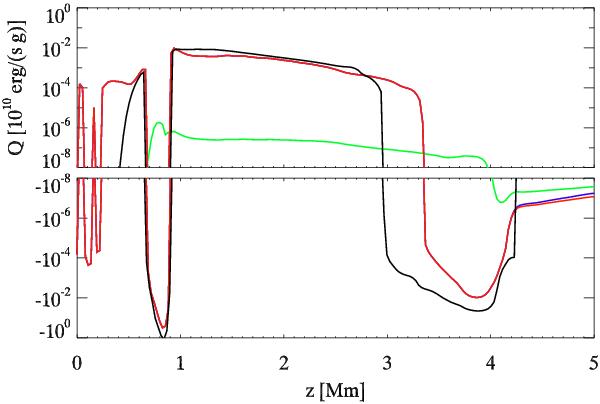
Comparison of the parameterized radiative heating rate due to Ca ii (QCa, see Eq. (13)) to the heating computed based on a detailed radiative transfer computation. Black: QCa. Blue: heating due to Ca ii lines. Green: heating due to Ca ii continua. Red: total Ca ii heating. The blue curve is nearly equal to the red curve.
Current usage metrics show cumulative count of Article Views (full-text article views including HTML views, PDF and ePub downloads, according to the available data) and Abstracts Views on Vision4Press platform.
Data correspond to usage on the plateform after 2015. The current usage metrics is available 48-96 hours after online publication and is updated daily on week days.
Initial download of the metrics may take a while.