Fig. 6
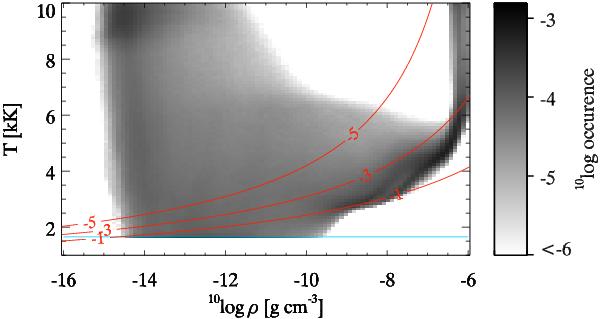
Diagram of the occurrence of temperature as function of mass density in the simulation. The red contours show the fraction of hydrogen atoms bound in H2 molecules, 2nH2/(nH i + 2nH2), as function of temperature and mass density, assuming ICE and all hydrogen neutral. The contours are spaced a factor 100 apart, with the labels indicating the exponent a in 10a. The blue line at T = 1.66 kK specifies the threshold for the ad hoc heating (Eq. (15)).
Current usage metrics show cumulative count of Article Views (full-text article views including HTML views, PDF and ePub downloads, according to the available data) and Abstracts Views on Vision4Press platform.
Data correspond to usage on the plateform after 2015. The current usage metrics is available 48-96 hours after online publication and is updated daily on week days.
Initial download of the metrics may take a while.