Fig. 5
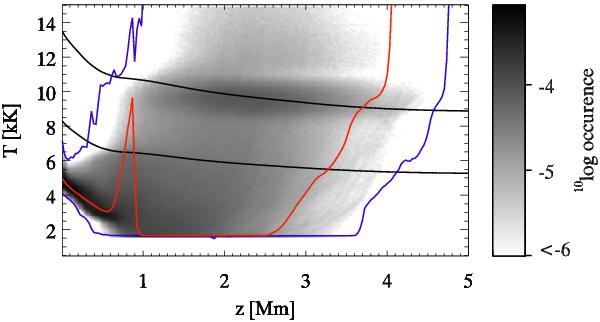
Diagram of the temperature occurrence as function of atmospheric height in the simulation. The red curve shows the temperature in the column marked in Fig. 1. The blue curves indicate the minimum and maximum temperatures as a function of height during the whole simulation run. The black curves shows the location of 50% He i (top curve) and H (bottom curve) ionization assuming Saha equilibrium and the average run of the electron density with height.
Current usage metrics show cumulative count of Article Views (full-text article views including HTML views, PDF and ePub downloads, according to the available data) and Abstracts Views on Vision4Press platform.
Data correspond to usage on the plateform after 2015. The current usage metrics is available 48-96 hours after online publication and is updated daily on week days.
Initial download of the metrics may take a while.