Fig. 6
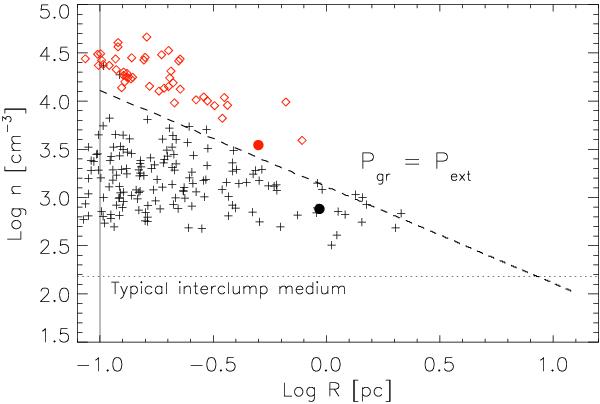
Relation between the mean density and size of the structures (clumps) defined by
thresholding at  . The
dotted line shows the typical density of the interclump medium (i.e. the density of
the diffuse component). The dashed line shows the density above which the
gravitational energy of the clump becomes higher than the external surface pressure
(Pgr = Pext). The red
diamonds show the structures identified from the column density maps by thresholding
at
. The
dotted line shows the typical density of the interclump medium (i.e. the density of
the diffuse component). The dashed line shows the density above which the
gravitational energy of the clump becomes higher than the external surface pressure
(Pgr = Pext). The red
diamonds show the structures identified from the column density maps by thresholding
at  . The
resolution limit of the column density data is at log R = −1.0.
The black solid circle marks the clump B5 in Perseus, and similarly, the red solid
circle marks the same clump when using the threshold of
.
. The
resolution limit of the column density data is at log R = −1.0.
The black solid circle marks the clump B5 in Perseus, and similarly, the red solid
circle marks the same clump when using the threshold of
.
Current usage metrics show cumulative count of Article Views (full-text article views including HTML views, PDF and ePub downloads, according to the available data) and Abstracts Views on Vision4Press platform.
Data correspond to usage on the plateform after 2015. The current usage metrics is available 48-96 hours after online publication and is updated daily on week days.
Initial download of the metrics may take a while.