Fig. 4
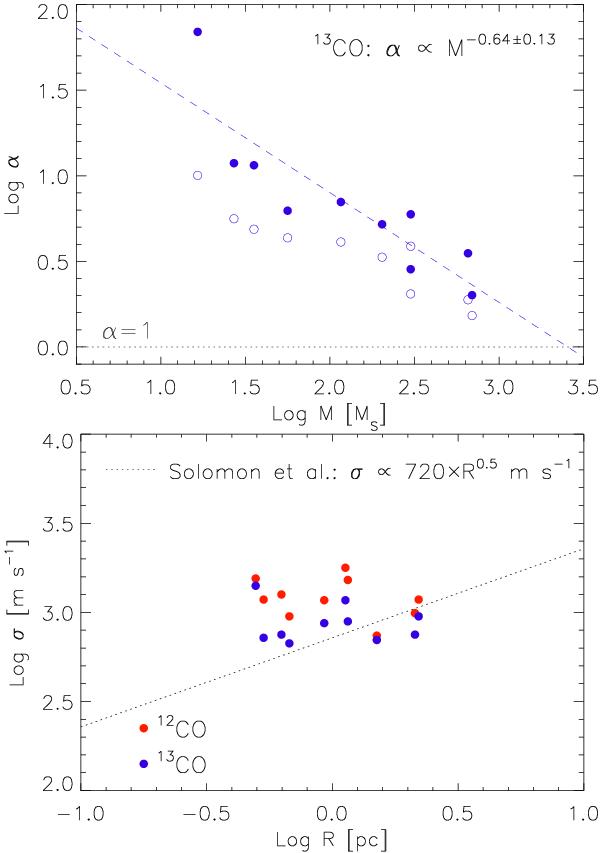
Top: virial parameters derived for clumps identified in the
Ophiuchus and Perseus clouds using thresholding at
 .
In calculating the virial parameter, linewidths derived from 13CO data
from the COMPLETE survey (Ridge et al.
2006a) were used. The dashed line shows the slope corresponding to the
relation
α ∝ M−2/3,
predicted for clumps confined by external pressure (Bertoldi & McKee 1992). A linear fit to the data points yields
the slope −0.64 ± 0.13. The open circles show the modified virial parameters of
the same clumps,
.
In calculating the virial parameter, linewidths derived from 13CO data
from the COMPLETE survey (Ridge et al.
2006a) were used. The dashed line shows the slope corresponding to the
relation
α ∝ M−2/3,
predicted for clumps confined by external pressure (Bertoldi & McKee 1992). A linear fit to the data points yields
the slope −0.64 ± 0.13. The open circles show the modified virial parameters of
the same clumps,  ,
that take into account the external confining pressure (see Sect. 3.2 in text). The dotted line indicates the
α = 1 (and
,
that take into account the external confining pressure (see Sect. 3.2 in text). The dotted line indicates the
α = 1 (and  ) level.
Bottom: size-linewidth relation for the same clumps, shown for
both 12CO (red) and 13CO (blue). The dotted line shows the
σ ∝ R0.5 relation (Solomon et al. 1987), not a fit to the data
points.
) level.
Bottom: size-linewidth relation for the same clumps, shown for
both 12CO (red) and 13CO (blue). The dotted line shows the
σ ∝ R0.5 relation (Solomon et al. 1987), not a fit to the data
points.
Current usage metrics show cumulative count of Article Views (full-text article views including HTML views, PDF and ePub downloads, according to the available data) and Abstracts Views on Vision4Press platform.
Data correspond to usage on the plateform after 2015. The current usage metrics is available 48-96 hours after online publication and is updated daily on week days.
Initial download of the metrics may take a while.