Fig. 3
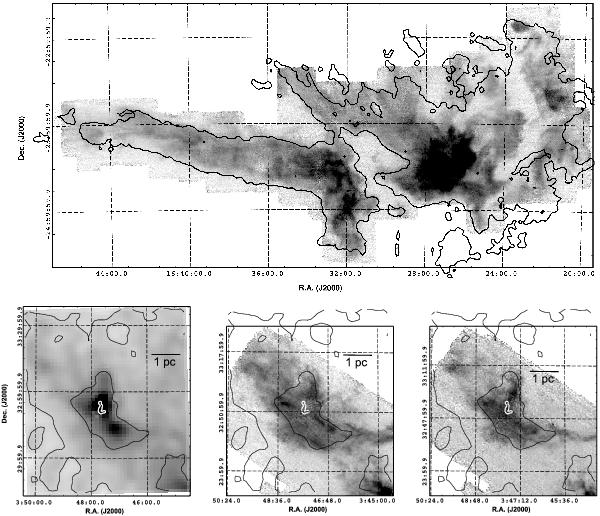
Comparison of the dense component, i.e., structures above
 , with
the CO molecular line emission. Top: 12CO line
emission from the COMPLETE survey for Ophiuchus, with a contour of
, with
the CO molecular line emission. Top: 12CO line
emission from the COMPLETE survey for Ophiuchus, with a contour of
 mag overplotted.
Bottom row: similar comparison for the B5 globule in Perseus.
The left panel shows the extinction map, with black contours at
AV = [1,3] mag. The white
contour shows the extent of the coherent core in which the linewidth of the
NH3 molecule emission drops abruptly, identified by Pineda et al. (2010a). The center
and right panels show the same for the 12CO
and 13CO line emission, respectively.
mag overplotted.
Bottom row: similar comparison for the B5 globule in Perseus.
The left panel shows the extinction map, with black contours at
AV = [1,3] mag. The white
contour shows the extent of the coherent core in which the linewidth of the
NH3 molecule emission drops abruptly, identified by Pineda et al. (2010a). The center
and right panels show the same for the 12CO
and 13CO line emission, respectively.
Current usage metrics show cumulative count of Article Views (full-text article views including HTML views, PDF and ePub downloads, according to the available data) and Abstracts Views on Vision4Press platform.
Data correspond to usage on the plateform after 2015. The current usage metrics is available 48-96 hours after online publication and is updated daily on week days.
Initial download of the metrics may take a while.