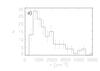
Fig. 2
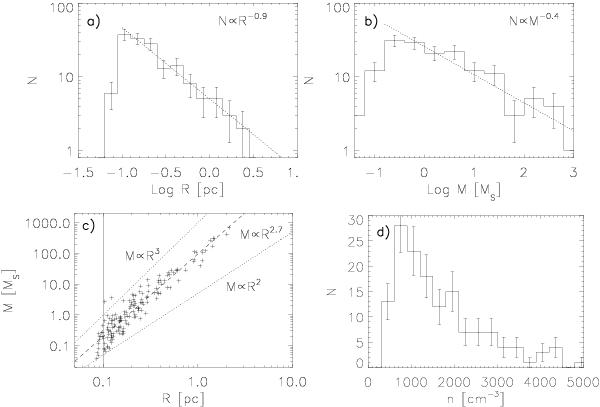
Characteristics of the structures (clumps) defined by a thresholding at
 (see
Sect. 3.1.1 in text). a) The
size distribution. Error bars show the
(see
Sect. 3.1.1 in text). a) The
size distribution. Error bars show the  uncertainty. The dotted line shows the least-squares fit to the distribution, with
the slope −0.9 ± 0.2. b) The same for the mass distribution. The
linear fit results in the slope −0.4 ± 0.2. c) The
mass-radius relation. Overplotted are slopes indicating
M ∝ R3 and
M ∝ R2 (dotted lines), the linear
fit to the data points which has a slope 2.7 ± 0.2 (dashed line), and the
resolution limit R = 0.1 pc of the data (solid line). d)
The distribution of mean volume densities.
uncertainty. The dotted line shows the least-squares fit to the distribution, with
the slope −0.9 ± 0.2. b) The same for the mass distribution. The
linear fit results in the slope −0.4 ± 0.2. c) The
mass-radius relation. Overplotted are slopes indicating
M ∝ R3 and
M ∝ R2 (dotted lines), the linear
fit to the data points which has a slope 2.7 ± 0.2 (dashed line), and the
resolution limit R = 0.1 pc of the data (solid line). d)
The distribution of mean volume densities.
Current usage metrics show cumulative count of Article Views (full-text article views including HTML views, PDF and ePub downloads, according to the available data) and Abstracts Views on Vision4Press platform.
Data correspond to usage on the plateform after 2015. The current usage metrics is available 48-96 hours after online publication and is updated daily on week days.
Initial download of the metrics may take a while.