Free Access
Fig. 2
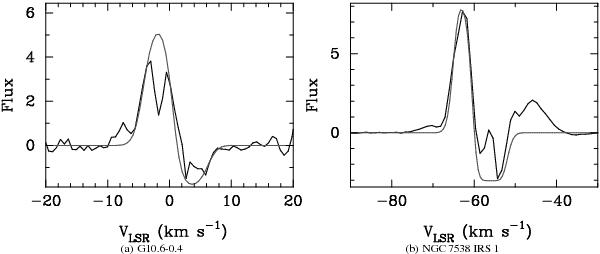
CO (J = 2–1) spectra integrated over the infall regions overlapping with the HII regions for G10.6 (left) and NGC 7538 (right). The grey lines shows the 2 layer infall model characterized by the parameters given in Table 4.
This figure is made of several images, please see below:
Current usage metrics show cumulative count of Article Views (full-text article views including HTML views, PDF and ePub downloads, according to the available data) and Abstracts Views on Vision4Press platform.
Data correspond to usage on the plateform after 2015. The current usage metrics is available 48-96 hours after online publication and is updated daily on week days.
Initial download of the metrics may take a while.