Fig. 1
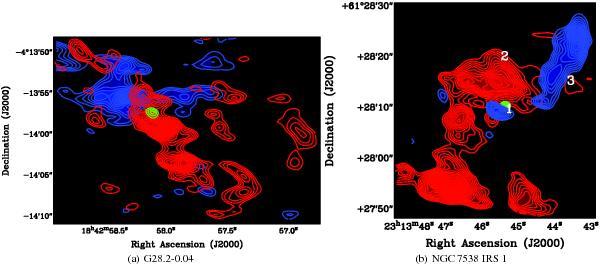
Large-scale Molecular Outflows: in both figures, the blue and red contours (and colours) show the blue and red shifted CO emission integrated over the velocity ranges given in Table 2 starting at 5σ (3σ), and increasing in intervals of 1σ. The green contours represents the continuum emission, starting at 50% of the peak emission. In the right panel, the numbers indicate the locations of IRS 1, 2, and 3.
Current usage metrics show cumulative count of Article Views (full-text article views including HTML views, PDF and ePub downloads, according to the available data) and Abstracts Views on Vision4Press platform.
Data correspond to usage on the plateform after 2015. The current usage metrics is available 48-96 hours after online publication and is updated daily on week days.
Initial download of the metrics may take a while.