Fig. 3
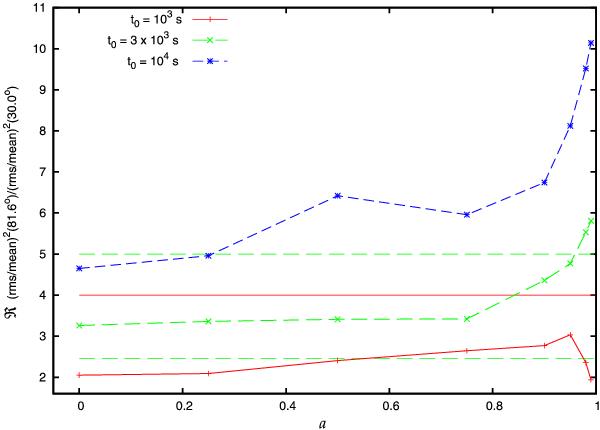
The ratio ℛ of normalized variance at the observer inclination angle θo = 81.6° with respect to the case θo = 30°. The dependence on the dimensionless Kerr black hole parameter a is plotted for the assumed emissivity profile β = 3.5, for three values of the flare lifetime scale t0, as indicated in the plot. Three horizontal lines give the enhancement ratio ℛ for NGC 4258 given in Eq. (10) (middle line), and the range of errors (upper and lower lines). The simulated light curves were longer by factor 8 compared to those used in Figs. 1, 2.
Current usage metrics show cumulative count of Article Views (full-text article views including HTML views, PDF and ePub downloads, according to the available data) and Abstracts Views on Vision4Press platform.
Data correspond to usage on the plateform after 2015. The current usage metrics is available 48-96 hours after online publication and is updated daily on week days.
Initial download of the metrics may take a while.