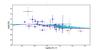
Fig. 2

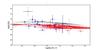
Abundance ratios S/Zn versus Zn/H in DLA systems. Symbols with error bars: measurements for the samples of DLA systems listed in Table 4; curves: predictions of the models of galactic chemical evolution presented in Sect. 4. Blue diamonds: sample used to select the models of galactic chemical evolution (first part of Table 4); red circles: molecular DLA systems (second part of Table 4); black square: DLA system with peculiar nucleosynthetic abundances (last row in Table 4). Top panel: thin, cyan curves: models that pass the  selection condition (Eq. (8)); thick, magenta curve: best-fit reference model. Bottom panel: solid, red curves: dwarf models rejected by the selection process; black, dotted curves: Milky Way models rejected by the selection process.
Current usage metrics show cumulative count of Article Views (full-text article views including HTML views, PDF and ePub downloads, according to the available data) and Abstracts Views on Vision4Press platform.
Data correspond to usage on the plateform after 2015. The current usage metrics is available 48-96 hours after online publication and is updated daily on week days.
Initial download of the metrics may take a while.