Free Access
Fig. A.1
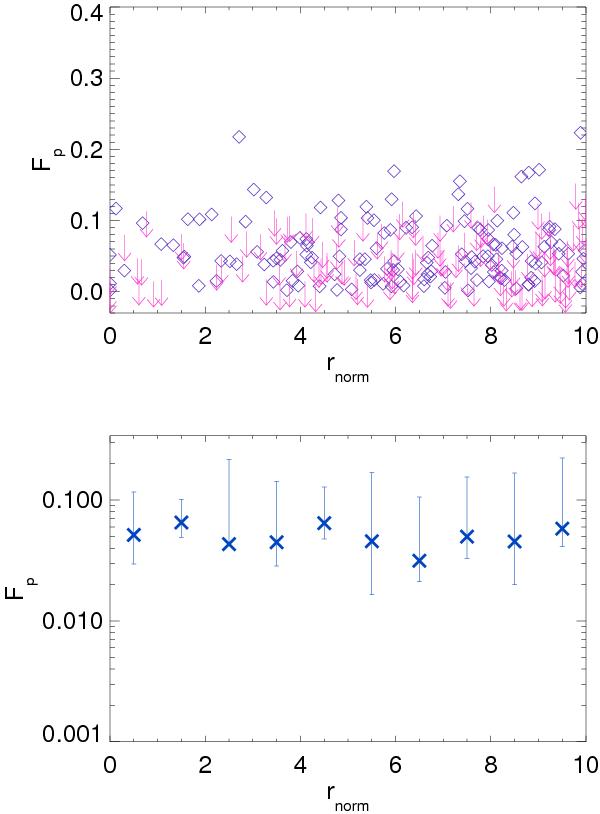
Fractional polarization of sources versus projected distance. Sources are centered on a position that is 10 rc far from the cluster center. Arrows indicate upper limits. Bottom panel: crosses refer to the median of the KM estimator is each bin, bars indicate the 14th and 84th percentile. No trend is detected in this case.
Current usage metrics show cumulative count of Article Views (full-text article views including HTML views, PDF and ePub downloads, according to the available data) and Abstracts Views on Vision4Press platform.
Data correspond to usage on the plateform after 2015. The current usage metrics is available 48-96 hours after online publication and is updated daily on week days.
Initial download of the metrics may take a while.