Free Access
Fig. 3
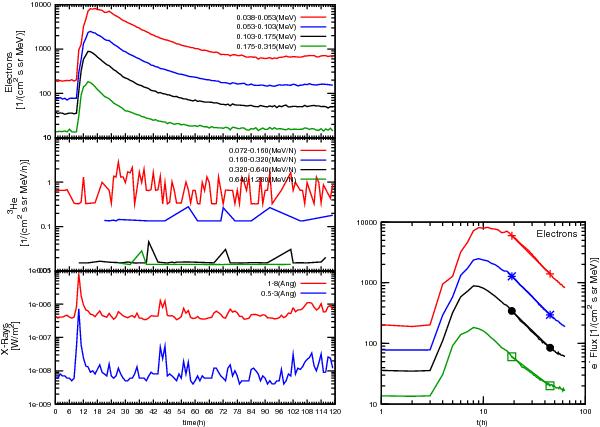
2001 July 19 impulsive event. On the left: lin-log graph of fluxes data; from top to bottom: proton flux from ACE/EPAM, 3He flux from ACE/ULEIS and X-rays from GOES/SEM. On the right: electrons log-log graph with linear fit in descending zone.
Current usage metrics show cumulative count of Article Views (full-text article views including HTML views, PDF and ePub downloads, according to the available data) and Abstracts Views on Vision4Press platform.
Data correspond to usage on the plateform after 2015. The current usage metrics is available 48-96 hours after online publication and is updated daily on week days.
Initial download of the metrics may take a while.