Fig. 1
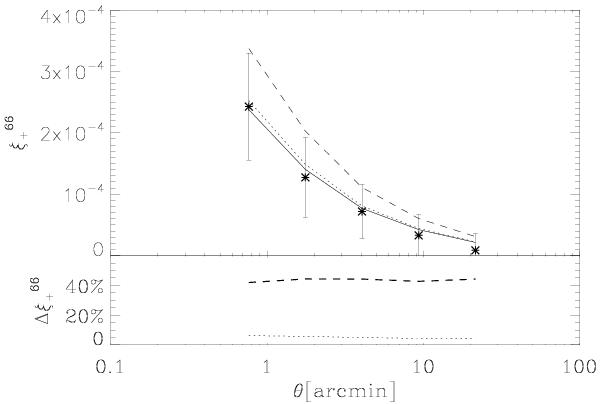
Correlation function  . Top panel shows the measurement (points with error bars), the best-fit GR model for a non-tomographic analysis (Ωm = 0.27, σ8 = 0.76) (solid), modified gravity models with the same standard parameters but (Σ = 1.6, γ = 0.55) (dashed), or (Σ = 1, γ = 0.65) (dotted). Bottom panel shows the deviation between the same dashed and dotted models with respect to the GR model.
Current usage metrics show cumulative count of Article Views (full-text article views including HTML views, PDF and ePub downloads, according to the available data) and Abstracts Views on Vision4Press platform.
Data correspond to usage on the plateform after 2015. The current usage metrics is available 48-96 hours after online publication and is updated daily on week days.
Initial download of the metrics may take a while.