Fig. 6
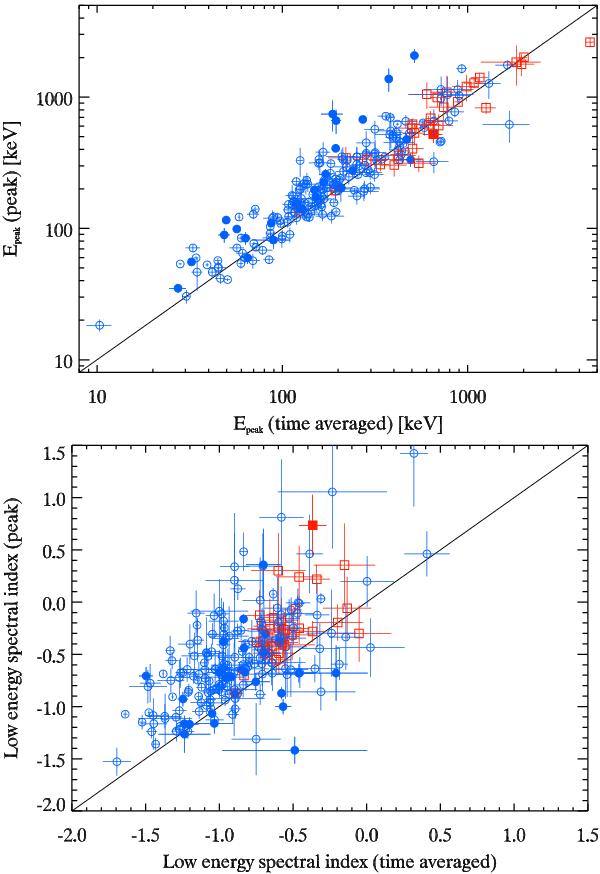
Comparison of time-integrated and peak-flux spectral parameters for the 227 GRBs whose peak spectrum could be fitted with the Band or CPL model (reported in Table 4 and present also in Table 2). Top panel: peak energy. Bottom panel: low-energy spectral index (α). Empty (filled) symbols are GRBs for which the time-integrated and the peak flux spectra have same (different) best fit model. Squares refer to short events and circles to long events.
Current usage metrics show cumulative count of Article Views (full-text article views including HTML views, PDF and ePub downloads, according to the available data) and Abstracts Views on Vision4Press platform.
Data correspond to usage on the plateform after 2015. The current usage metrics is available 48-96 hours after online publication and is updated daily on week days.
Initial download of the metrics may take a while.