Fig. 4
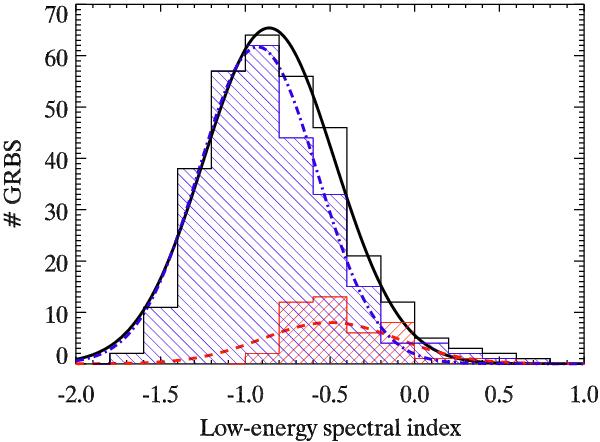
Distribution of the low-energy photon index for the 318 GRBs listed in Table 2 fitted with either the Band or CPL model and with determined  . The solid (black) line shows the fit with a Gaussian. Also shown (hatched blue and red histograms) are the distributions for 274 long and 44 short GRBs, respectively, and their Gaussian fits (dot-dashed and dashed line for long and short events, respectively).
Current usage metrics show cumulative count of Article Views (full-text article views including HTML views, PDF and ePub downloads, according to the available data) and Abstracts Views on Vision4Press platform.
Data correspond to usage on the plateform after 2015. The current usage metrics is available 48-96 hours after online publication and is updated daily on week days.
Initial download of the metrics may take a while.