Fig. 1
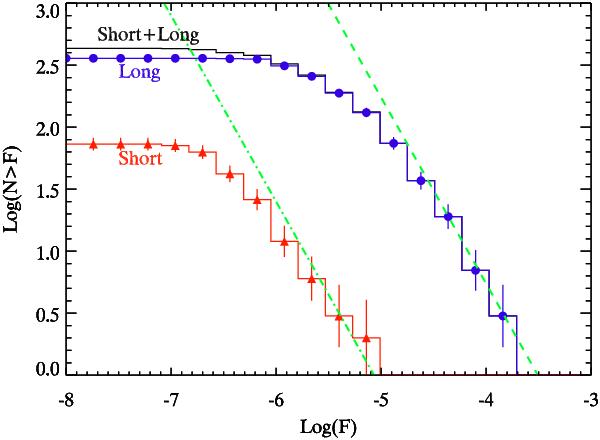
LogN − LogF of the 432 GRBs analyzed in this work (Tables 2 and 3). Short GRBs (73 events) and long GRBs (359 events) are shown with (red) triangles and (blue) circles, respectively. The black histogram refers to the entire sample. The dashed and dot-dashed lines are two power-laws with slope –3/2. The fluence F in erg/cm2 is obtained by integrating the best-fit model in the 8 keV–1 MeV energy range.
Current usage metrics show cumulative count of Article Views (full-text article views including HTML views, PDF and ePub downloads, according to the available data) and Abstracts Views on Vision4Press platform.
Data correspond to usage on the plateform after 2015. The current usage metrics is available 48-96 hours after online publication and is updated daily on week days.
Initial download of the metrics may take a while.