Fig. 5
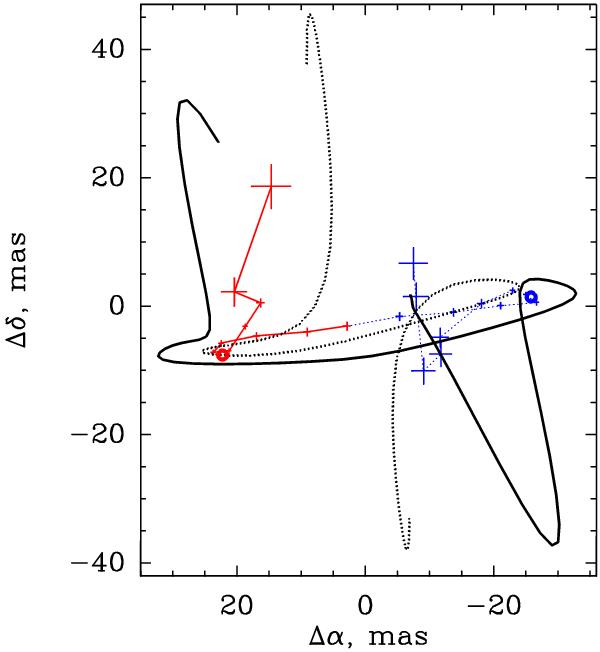
Predictions for the relative centroid positions of the H30α emissions derived for two different kinematical models superimposed (as blue and red thin lines) on the observed data for MWC 349. The thick black line shows the results for the case when photoevaporation occurs at a radius larger than the gravitational radius. The dotted black line shows the case when the ionized outflow does not follow the disk rotation. The radial velocities are the same as in Fig. 4.
Current usage metrics show cumulative count of Article Views (full-text article views including HTML views, PDF and ePub downloads, according to the available data) and Abstracts Views on Vision4Press platform.
Data correspond to usage on the plateform after 2015. The current usage metrics is available 48-96 hours after online publication and is updated daily on week days.
Initial download of the metrics may take a while.