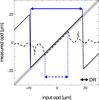
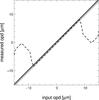
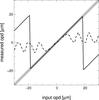
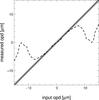
Fig. 5
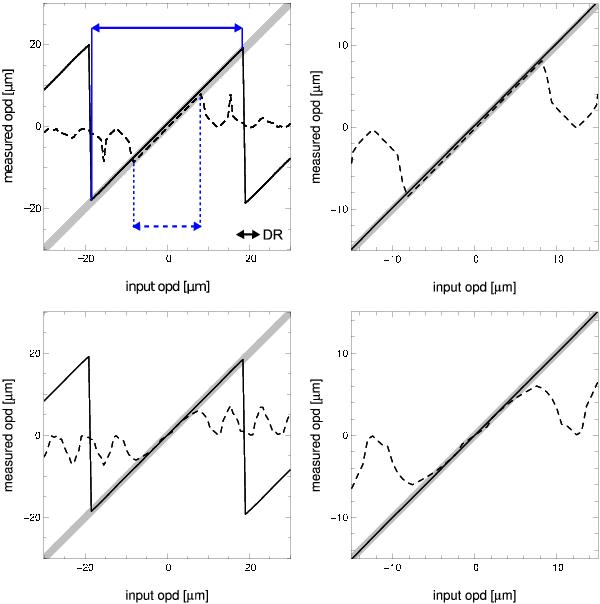
Response of the dispersed and temporal group delay estimators (solid and dashed lines respectively) to an OPD ramp xGD in the H-band. The ideal response is represented by the large gray line. In all cases, the coherence envelope has a sinc shape. Top: the envelope model is a sinc function. Bottom: the envelope model is a parabola. Figures on the right are a zoom on the central part of the left-hand side figures. The DR limits are represented with blue arrows on the top-left plot in the ideal case for both estimators.
Current usage metrics show cumulative count of Article Views (full-text article views including HTML views, PDF and ePub downloads, according to the available data) and Abstracts Views on Vision4Press platform.
Data correspond to usage on the plateform after 2015. The current usage metrics is available 48-96 hours after online publication and is updated daily on week days.
Initial download of the metrics may take a while.