Fig. 4
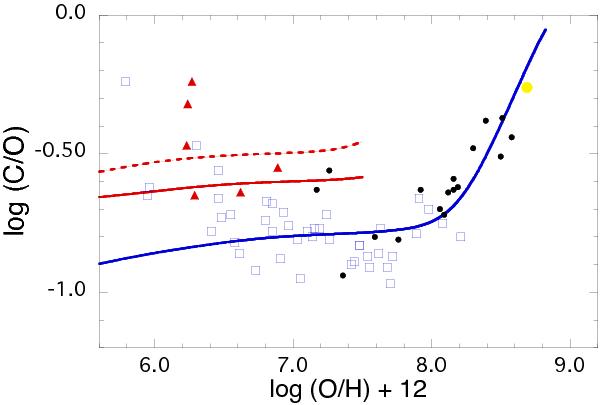
Predicted C/O evolution of the ISM against O/H with three different upper mass ends in the IMF, i.e., 40 M⊙ (blue solid curve), 25 M⊙ (red solid curve), and 20 M⊙ (red dotted curve). In the second and third models, the calculations stop when the metallicity reaches log (O/H) + 12 = 7.5. The symbols of the observed data are the same as in Fig. 1.
Current usage metrics show cumulative count of Article Views (full-text article views including HTML views, PDF and ePub downloads, according to the available data) and Abstracts Views on Vision4Press platform.
Data correspond to usage on the plateform after 2015. The current usage metrics is available 48-96 hours after online publication and is updated daily on week days.
Initial download of the metrics may take a while.