Fig. 9
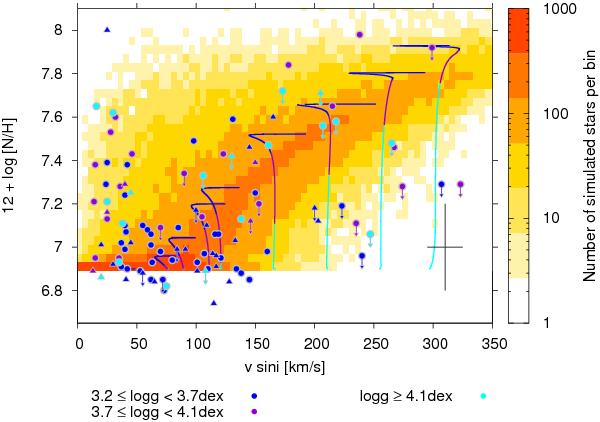
Hunter-plot showing projected rotational velocity against nitrogen enhancement. Our population synthesis is shown as a density plot in the background. The color coding corresponds to the number of stars per pixel. Overplotted are data from Hunter et al. (2009a), with surface gravities as indicated by the color (see figure key). Single stars are plotted as circles, radial velocity variables as triangles. Evolutionary tracks of 13 M⊙, corresponding to the average mass of the sample stars, are shown with their surface gravity coded by the same colors as the observations. The velocities of the tracks have been multiplied by π/4, to account for the average projection effect. The cross in the lower right corner shows the typical error on the observations.
Current usage metrics show cumulative count of Article Views (full-text article views including HTML views, PDF and ePub downloads, according to the available data) and Abstracts Views on Vision4Press platform.
Data correspond to usage on the plateform after 2015. The current usage metrics is available 48-96 hours after online publication and is updated daily on week days.
Initial download of the metrics may take a while.