Fig. 6
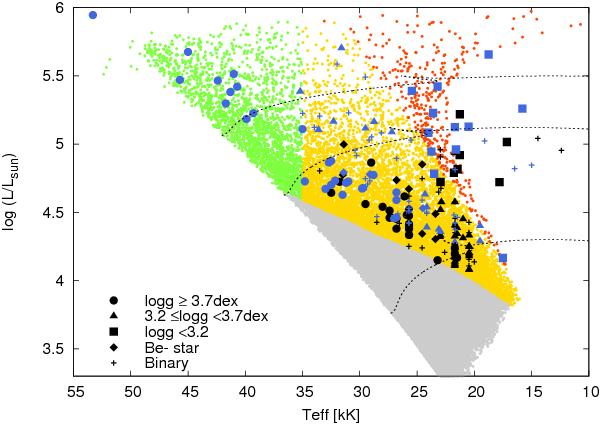
H-R diagram of our population synthesis using the initial distributions discussed in Sect. 3.2. Regions subject to selection effects (Sect. 3.3) are highlighted as: gray – stars too faint for the observed magnitude cutoff; green – stars with Teff > 35 kK; red – stars with low surface gravities (log g < 3.2); yellow – remaining stars. Results from Hunter et al. (2009a) are over-plotted (blue: stars in N11; black: NGC 2004; with their shapes indicating their surface gravities). Radial velocity variables and Be-stars that are indicated by crosses and diamonds, respectively. Evolutionary tracks of 10 M⊙, 20 M⊙ and 30 M⊙ of non-rotating models are shown for orientation.
Current usage metrics show cumulative count of Article Views (full-text article views including HTML views, PDF and ePub downloads, according to the available data) and Abstracts Views on Vision4Press platform.
Data correspond to usage on the plateform after 2015. The current usage metrics is available 48-96 hours after online publication and is updated daily on week days.
Initial download of the metrics may take a while.