Fig. 5
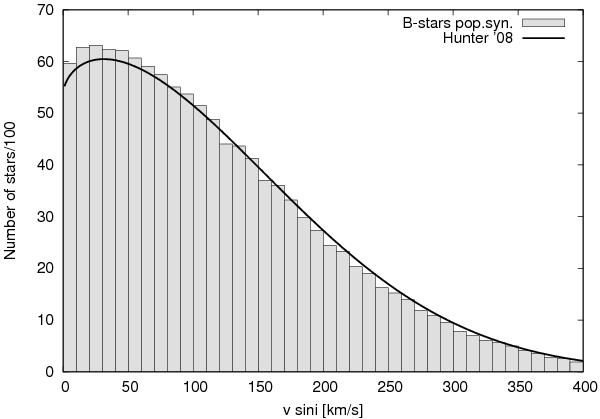
The projected rotational velocity distribution found by Hunter et al. (2008b) for non-binary, non-supergiant stars of this sample with masses ≤ 25 M⊙ (black line). This is used as our initial rotational velocity distribution. The gray histogram represents the rotational velocity distribution of our simulated population, after application of all selection effects described in Sect. 3.3.
Current usage metrics show cumulative count of Article Views (full-text article views including HTML views, PDF and ePub downloads, according to the available data) and Abstracts Views on Vision4Press platform.
Data correspond to usage on the plateform after 2015. The current usage metrics is available 48-96 hours after online publication and is updated daily on week days.
Initial download of the metrics may take a while.