Fig. 4
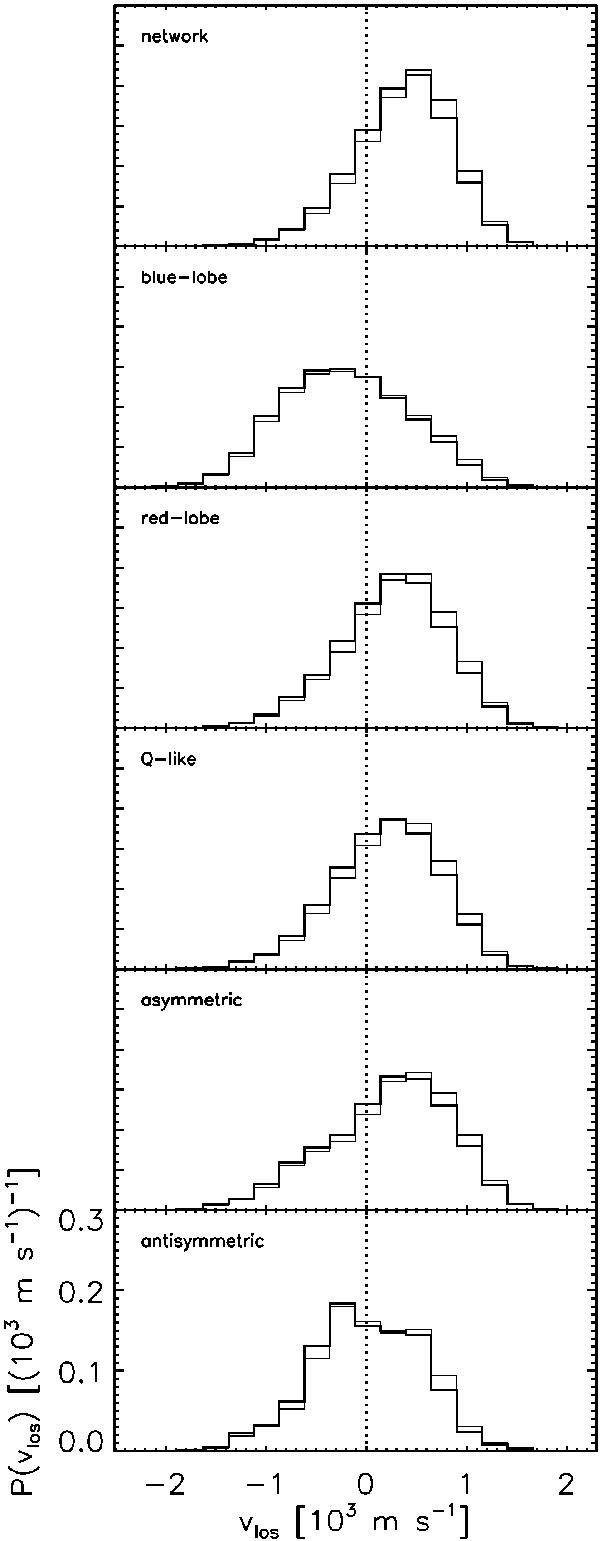
Statistics of the LOS velocities (vlos) of the pixels associated with each family of Stokes V shapes. Each plot contains the histograms of the vlos derived from both Fe i 630.15 nm (thick lines) and Fe i 630.25 nm (thin lines). The histograms are normalized to the total number of profiles in the family. The vertical dotted lines separate the upflow regime (left) and the downflow regime (right).
Current usage metrics show cumulative count of Article Views (full-text article views including HTML views, PDF and ePub downloads, according to the available data) and Abstracts Views on Vision4Press platform.
Data correspond to usage on the plateform after 2015. The current usage metrics is available 48-96 hours after online publication and is updated daily on week days.
Initial download of the metrics may take a while.