Fig. 3
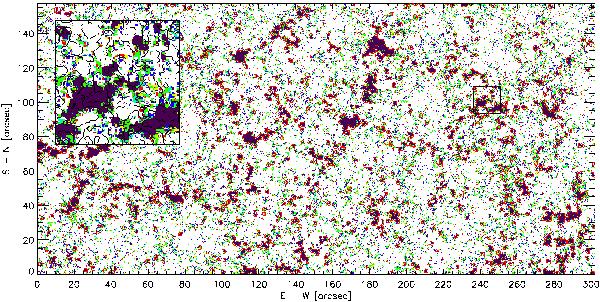
Spatial distribution of the profile families. Each color is representative of a single family according to the color code in Fig. 1. White pixels are the ones with max(| V|) < 4.5 × σV, which are excluded from the classification analysis. Red contours highlight the network regions in the FOV. The inset contains a 15 × 15 Mm2 detail of the FOV (black square) for a better visualization of the small family patches around a network region. The black contours highlight the regions with continuum intensity above the average continuum intensity of the FOV, i.e., the granules.
Current usage metrics show cumulative count of Article Views (full-text article views including HTML views, PDF and ePub downloads, according to the available data) and Abstracts Views on Vision4Press platform.
Data correspond to usage on the plateform after 2015. The current usage metrics is available 48-96 hours after online publication and is updated daily on week days.
Initial download of the metrics may take a while.