Free Access
Fig. 2
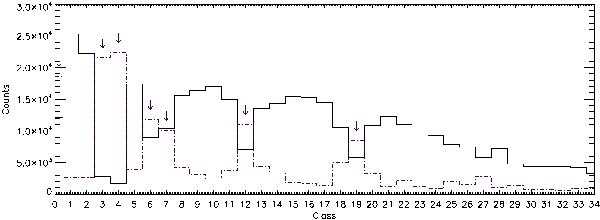
Histograms with the number of pixels in each class considering network regions (purple dot-dashed line) and IN regions (black solid line) separately. The arrows point out the network classes as derived from the statistics.
Current usage metrics show cumulative count of Article Views (full-text article views including HTML views, PDF and ePub downloads, according to the available data) and Abstracts Views on Vision4Press platform.
Data correspond to usage on the plateform after 2015. The current usage metrics is available 48-96 hours after online publication and is updated daily on week days.
Initial download of the metrics may take a while.