Fig. 5
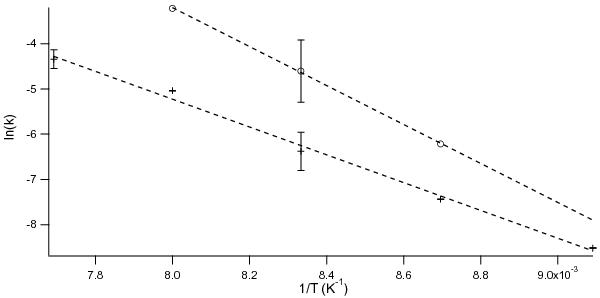
ln(k1) (crosses) and ln(k2) (circles) as a function of the inverse of the temperature, k1 and k2 being the rates for the HNCO + H2O → OCN−+H3O+ and the OCN−+H3O+ → HOCN + H2O reactions respectively. The uncertainty on a point is given by the dispersion of the measurements for the same temperature around the averaged value. The dashed lines represent the fit of the experimental points against an Arrhenius law.
Current usage metrics show cumulative count of Article Views (full-text article views including HTML views, PDF and ePub downloads, according to the available data) and Abstracts Views on Vision4Press platform.
Data correspond to usage on the plateform after 2015. The current usage metrics is available 48-96 hours after online publication and is updated daily on week days.
Initial download of the metrics may take a while.