Fig. 4
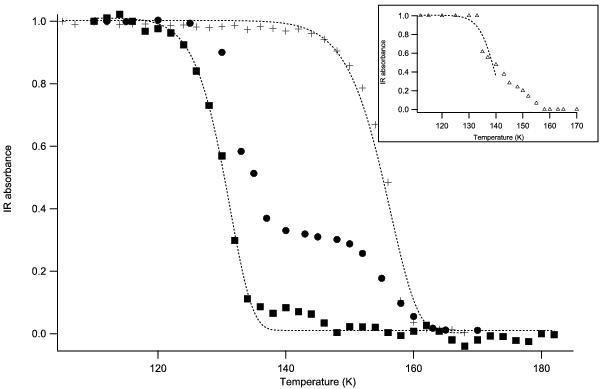
Desorption rate curves from the integrated absorbtion bands of pure HNCO (full squares) and HNCO for a HNCO:H2O mixture where H2O is in excess (crosses) and where H2O is not in excess (full circles). The dotted lines are the results from the fits using a first-order desorption rate (Eq. (3)). Inset: OCN− (triangles) desorption curve in a HNCO:H2O mixture where H2O is not in a 1:5 concentration ratio. Only the first part of the desorption curve is fitted, corresponding to the desorption of OCN− alone.
Current usage metrics show cumulative count of Article Views (full-text article views including HTML views, PDF and ePub downloads, according to the available data) and Abstracts Views on Vision4Press platform.
Data correspond to usage on the plateform after 2015. The current usage metrics is available 48-96 hours after online publication and is updated daily on week days.
Initial download of the metrics may take a while.