Fig. 3
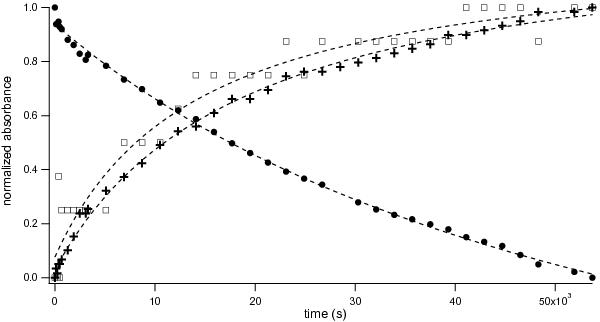
Time evolution of the HNCO (circles), OCN− (crosses) and HOCN (squares) normalized abundances recorded by FTIR spectroscopy at 120 K for a HNCO:H2O mixture in a 1:3 concentration ratio. Fitting the experimental data to the analytical expressions of evolution for each species (dashed lines) gives the reaction rates at T = 120 K.
Current usage metrics show cumulative count of Article Views (full-text article views including HTML views, PDF and ePub downloads, according to the available data) and Abstracts Views on Vision4Press platform.
Data correspond to usage on the plateform after 2015. The current usage metrics is available 48-96 hours after online publication and is updated daily on week days.
Initial download of the metrics may take a while.