Fig. 2
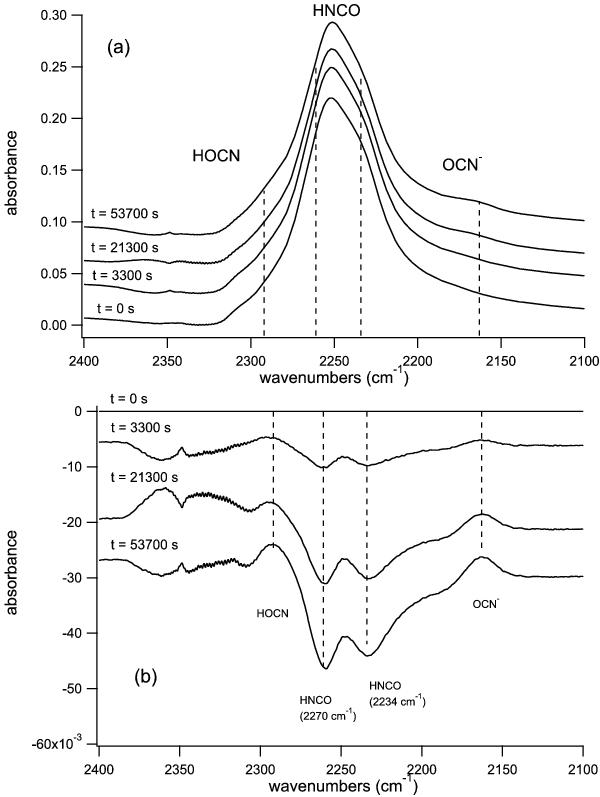
Infrared spectrum a) and difference spectrum (spectrum at time t minus spectrum at t = 0) b) of a HNCO:H2O mixture at T = 120 K at t = 0 s, 3300 s, 21 300 s and 53 700 s. OCN− has a band at 2170 cm-1 and HOCN at 2295 cm-1. The HNCO band has two components: one component at 2260 cm-1 corresponding to HNCO in a H2O environment and one component at 2234 cm-1 corresponding to HNCO in a HNCO environment. The variation of the second component is the result of a rearrangement that can give a positive band a 2251 cm-1 in some spectra. The bands at 2349 cm-1 correspond to fluctuations of the gas phase CO2.
Current usage metrics show cumulative count of Article Views (full-text article views including HTML views, PDF and ePub downloads, according to the available data) and Abstracts Views on Vision4Press platform.
Data correspond to usage on the plateform after 2015. The current usage metrics is available 48-96 hours after online publication and is updated daily on week days.
Initial download of the metrics may take a while.