Free Access
Fig. 8
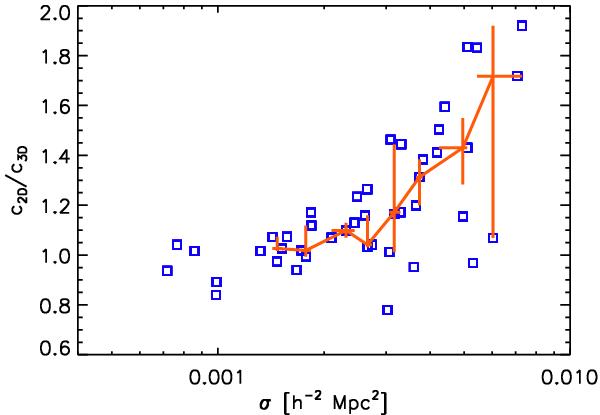
Concentration bias vs. the strong-lensing cross section. Each square represents a simulated cluster from a mock MACS catalog. The solid line is the median relation, while the error-bars indicate the inter-quartile ranges in each bin.
Current usage metrics show cumulative count of Article Views (full-text article views including HTML views, PDF and ePub downloads, according to the available data) and Abstracts Views on Vision4Press platform.
Data correspond to usage on the plateform after 2015. The current usage metrics is available 48-96 hours after online publication and is updated daily on week days.
Initial download of the metrics may take a while.