Free Access
Fig. 7
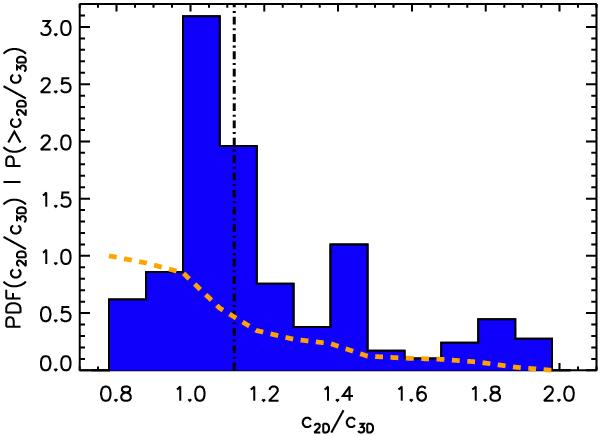
Probability density function of the ratios between two-dimensional and three-dimensional concentrations for clusters with the same properties as those in the MACS sample. The vertical dot-dashed line indicates the median of the distribution. The dashed line shows the cumulative distribution.
Current usage metrics show cumulative count of Article Views (full-text article views including HTML views, PDF and ePub downloads, according to the available data) and Abstracts Views on Vision4Press platform.
Data correspond to usage on the plateform after 2015. The current usage metrics is available 48-96 hours after online publication and is updated daily on week days.
Initial download of the metrics may take a while.