Fig. 13
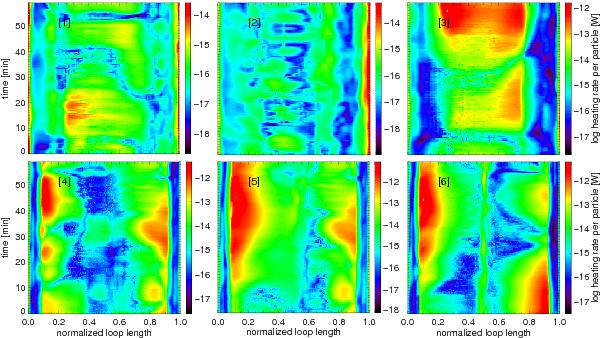
Heating rate per particle for one solar hour along magnetic field lines depicted in Fig. 12. Loop lengths are given in Table 1. The color table varies for each field line and is given on the righthand side of each panel. Loops # 1 to 3 are short, reaching any height below 10 Mm, while loops # 4 to 6 represent coronal loops (see Fig. 12).
Current usage metrics show cumulative count of Article Views (full-text article views including HTML views, PDF and ePub downloads, according to the available data) and Abstracts Views on Vision4Press platform.
Data correspond to usage on the plateform after 2015. The current usage metrics is available 48-96 hours after online publication and is updated daily on week days.
Initial download of the metrics may take a while.