Fig. 4
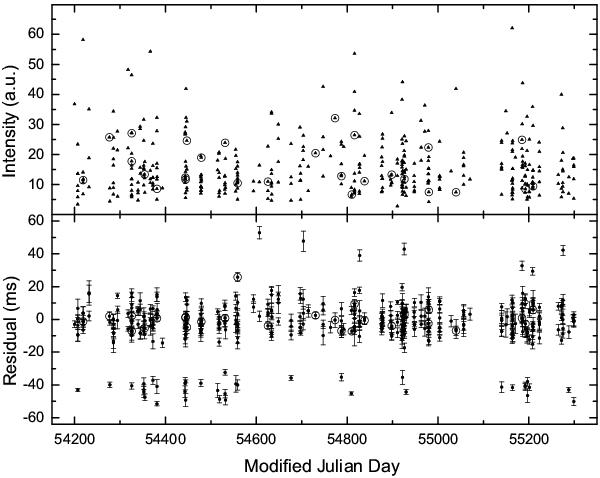
Variation in flux intensity with date (top) and timing residuals (bottom) for RRAT J1819 − 1458. The flux intensity is measured in an arbitrary unit and no remarkable deviation of flux density is shown in the variation plot. The timing residuals that show a distribution of three bands with ~ 40 ms intervals are calculated with the fitted parameters listed in Table 1. The rms of residuals is 17 ms and the error bars are 10σ. Dots with circles in the graphs are the counterparts of bimodal bursts and the gaps in date are due to observation scheduling.
Current usage metrics show cumulative count of Article Views (full-text article views including HTML views, PDF and ePub downloads, according to the available data) and Abstracts Views on Vision4Press platform.
Data correspond to usage on the plateform after 2015. The current usage metrics is available 48-96 hours after online publication and is updated daily on week days.
Initial download of the metrics may take a while.