Fig. 8
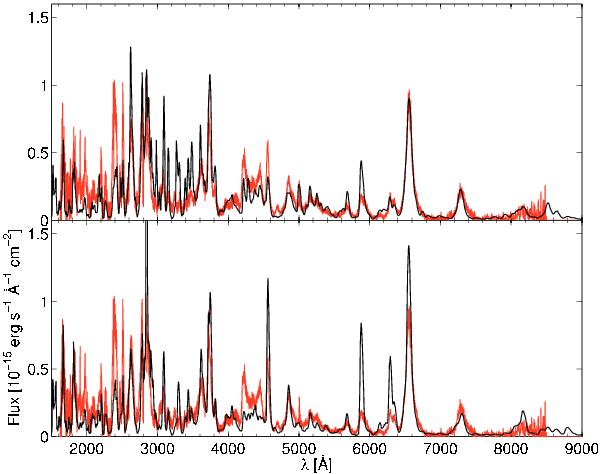
Standard model (assuming on-the-spot positron absorption) (upper, black) compared to a model assuming positron deposition in proportion to the electron content of each core zone (lower, black). The latter uses a 40% smaller 44Ti mass (in order to produce the correct total flux in the 2000–8000 Å range). The Mg I 2852 Å line continues up to ~3.1 × 10⁻¹⁵ in the bottom panel. The observed spectrum in red, same as in Fig. 3.
Current usage metrics show cumulative count of Article Views (full-text article views including HTML views, PDF and ePub downloads, according to the available data) and Abstracts Views on Vision4Press platform.
Data correspond to usage on the plateform after 2015. The current usage metrics is available 48-96 hours after online publication and is updated daily on week days.
Initial download of the metrics may take a while.