Fig. 6
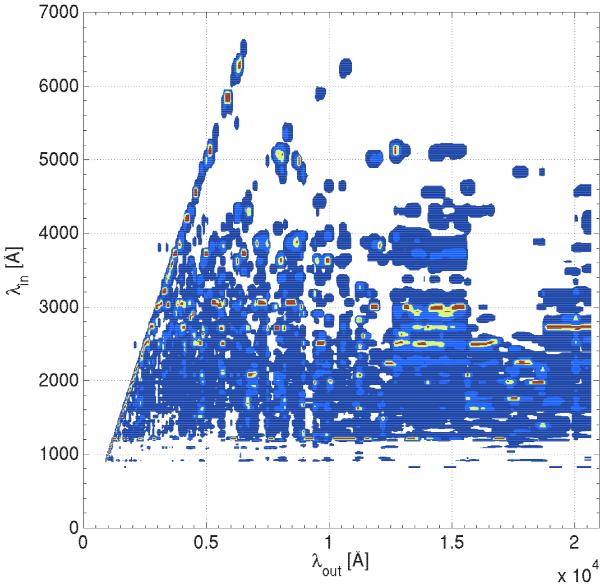
The fluorescence process illustrated by plotting emerging versus emitted wavelengths (λout and λin, respectively) for all escaping photons that were absorbed by a line at least once. The intensities are normalized in each λout-bin (Δλ/λ = 0.03), so that the dominant λin for each λout can be seen as the yellow/red regions. Contours are at 0.1, 1, 10, 50 and 90%. Very little fluorescence occurs for λin > 7000 Å, which is therefore excluded from the plot.
Current usage metrics show cumulative count of Article Views (full-text article views including HTML views, PDF and ePub downloads, according to the available data) and Abstracts Views on Vision4Press platform.
Data correspond to usage on the plateform after 2015. The current usage metrics is available 48-96 hours after online publication and is updated daily on week days.
Initial download of the metrics may take a while.