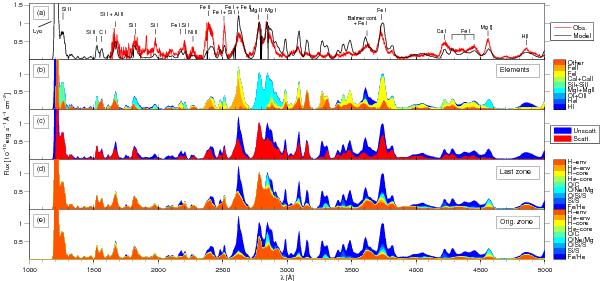
Fig. 3

Model spectrum at 2875 days for M(44Ti) = 1.5 × 10⁻⁴ M⊙ and τd = 1, together with the observed spectrum. The 1000–5000 Å range. a) The observed spectrum (red) versus the model spectrum (black). The observed spectrum was dereddened, corrected for redshift, and smoothed below 2200 Å and in the 7500–8500 Å range. b) The contributions by various selected elements to the flux. c) The part of the emerging flux that comes from scattering/fluorescence (red) and the part that is direct emission (blue). d) The zones in which the photons had their last interaction; this is the zone of emission if they did not scatter and the zone where they last experienced scattering or fluorescence if they did. e) The zones from where the photons were emitted before any scattering or fluorescence occurred. The color codings for panels 3–5 are on the right-hand side. Lyα extends to to a peak flux of 1.5 × 10⁻¹⁴ erg s-1 Å-1 cm-2. See also Sect. 4.3 in the text.
Current usage metrics show cumulative count of Article Views (full-text article views including HTML views, PDF and ePub downloads, according to the available data) and Abstracts Views on Vision4Press platform.
Data correspond to usage on the plateform after 2015. The current usage metrics is available 48-96 hours after online publication and is updated daily on week days.
Initial download of the metrics may take a while.


