Fig. 2
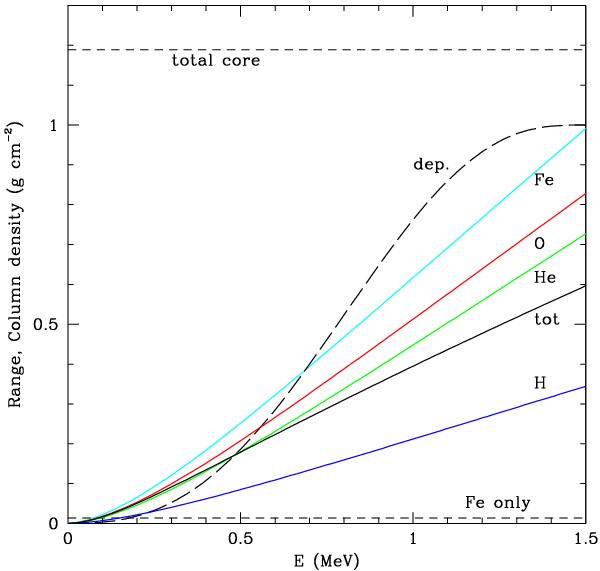
Positron stopping range for different elements as a function of kinetic energy. The solid black curve denoted “tot” shows the range weighted by the different zones in the core. The lower horizontal dashed line marks the column density of the Fe/He zone (assuming it to exist as a single clump), and the upper that of the full core for Vcore = 1800 km s-1. The long-dashed curve shows the cumulative positron distribution.
Current usage metrics show cumulative count of Article Views (full-text article views including HTML views, PDF and ePub downloads, according to the available data) and Abstracts Views on Vision4Press platform.
Data correspond to usage on the plateform after 2015. The current usage metrics is available 48-96 hours after online publication and is updated daily on week days.
Initial download of the metrics may take a while.