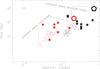
Fig. 6
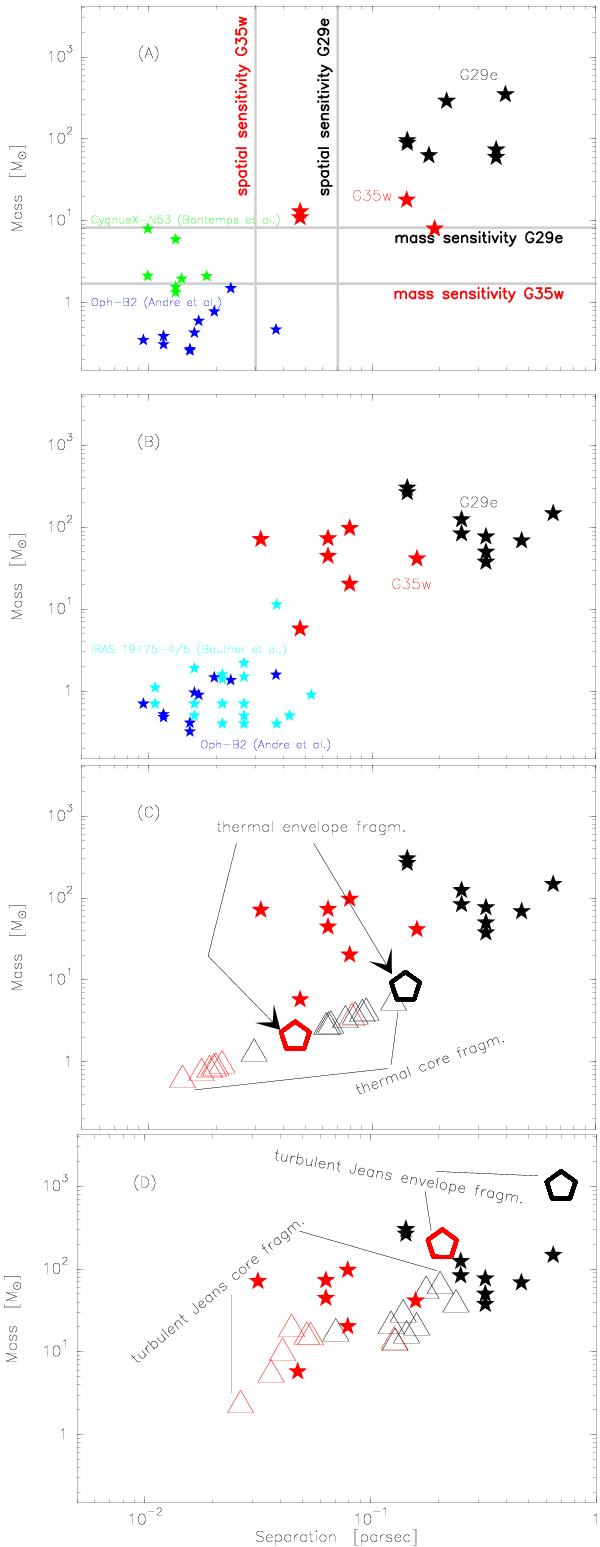
Separation versus core mass. For all panels, stars mark the observations, pentagons mark the envelope properties for thermal/turbulent Jeans fragmentation while triangles mark the core properties. Panel A) We used 1.3 mm PdBI data for G35.20w (red) and G29.96e (black). The mass sensitivity corresponds to a 3σ rms noise in the final 1.3 mm continuum map for a temperature of 20 K. Data for a high-mass CygnusX-N53 (Bontemps et al. 2010) and low mass protocluster Oph-B2 (André et al. 2007) is shown for comparison. The masses are derived from dust continuum for all the cores. Panel B) virial mass (scaled by mean virial parameter 0.3) derived from NH2D data versus separation. Data from two low mass clumps, Oph-B2 (André et al. 2007), and IRAS 19175-4/5 (Beuther & Henning 2009) is also shown for comparison. The masses correspond to virial masses derived from N2H + 1–0 observations. Panel C) Same as panel B with the corresponding thermal Jeans mass and length for the respective core density, and temperatures. Panel D) Same as panel B with the corresponding turbulent Jeans mass and length for the respective core density, and line width.
Current usage metrics show cumulative count of Article Views (full-text article views including HTML views, PDF and ePub downloads, according to the available data) and Abstracts Views on Vision4Press platform.
Data correspond to usage on the plateform after 2015. The current usage metrics is available 48-96 hours after online publication and is updated daily on week days.
Initial download of the metrics may take a while.