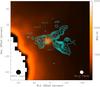
Fig. 4
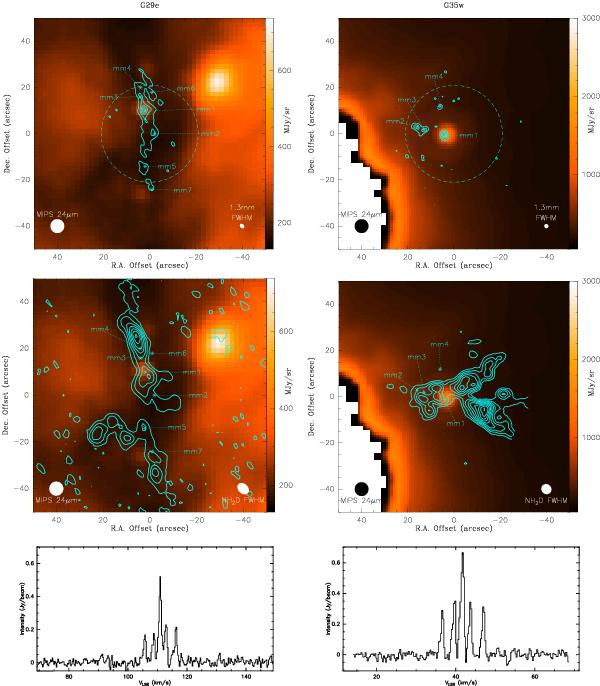
Top panels: Spitzer 24 μm map (color scale), and PdBI 1.3 mm emission intensity map with the PdBI 1.3 mm primary beam indicated as dashed circle. The contour levels start at −3σ, 3σ in steps of 5σ. Center panels: Spitzer 24 μm map (color scale), and PdBI NH2D peak intensity map. The NH2D contour levels start at −3σ, 3σ in steps of 2σ. Bottom panels: the NH2D spectra towards the brightest position for the respective sources in the top panel. The brightest NH2D peak is is clearly offset from the Spitzer point source and brightest mm core in both cases, and that the clumps are detected at high S/N through out the map.
Current usage metrics show cumulative count of Article Views (full-text article views including HTML views, PDF and ePub downloads, according to the available data) and Abstracts Views on Vision4Press platform.
Data correspond to usage on the plateform after 2015. The current usage metrics is available 48-96 hours after online publication and is updated daily on week days.
Initial download of the metrics may take a while.