Fig. 2
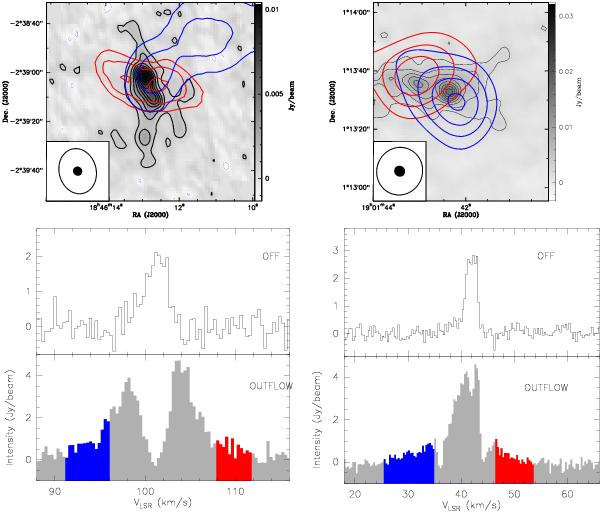
Top left: G29.96e PdBI 3.5 mm continuum plotted in gray-scales with HCO+ outflow overlaid in contours. Blue (red) contours represent the blueshifted (redshifted) shifted emission between velocities (LSR) of 91–96 km s-1 (108–112 km s-1). Top right: G35.20w PdBI 3.5 mm continuum plotted in gray-scales with HCO+ outflow overlaid in contours. Blue (red) contours represent the blueshifted (redshifted) shifted emission between velocities (LSR) of 25.5–35.0 km s-1 (46.6–53.6 km s-1). Bottom panels: the HCO+ spectra towards the brightest mm position mm1 (i.e. outflow source) and an OFF position for the respective sources in the top panel. The BIMA and PdBI beams are shown in white and black respectively.
Current usage metrics show cumulative count of Article Views (full-text article views including HTML views, PDF and ePub downloads, according to the available data) and Abstracts Views on Vision4Press platform.
Data correspond to usage on the plateform after 2015. The current usage metrics is available 48-96 hours after online publication and is updated daily on week days.
Initial download of the metrics may take a while.